Global wine production down in 2012, Europe declining, most others growing. Is Europe strangling its wine sector?
Global wine production decreased 6% in 2012 to 252 million hectolitres. This was partially due to a very small harvest in Europe but also a longer term trend. France, Italy and Spain are still the biggest producers. But the overall trend is a decline in European wine production and a rise in New World countries and China.
So now to the exciting things, wine production and wine consumption, after having looked at global vineyard surface and global grape production. First the world-wide wine production.
All numbers come from the recent OIV (International Organisation of Vine and Wine) report.
Wine production is decreasing, short term and long term
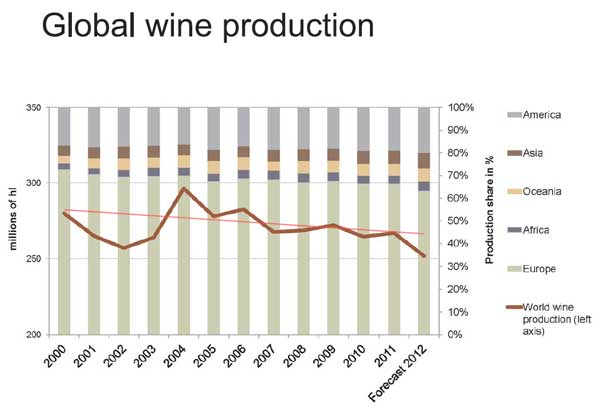
Global wine production in 2012 reached 252 million hectolitres (Mhl), or 25 billion litres. That was down 6% from 267 Mhl in 2011.
In a longer perspective, production has shrunk from 280 Mhl in 2000 with 10%. Compared with the average wine production over the period 2000-2012, which was 270 Mhl, the latest year is 7% lower.
The peak year for global wine production was 2004 when almost 300 Mhl (296 Mhl) was made.
The trend over the period is steadily but not dramatically decreasing.
But the decrease in wine production is solely caused by the decline in European wine production. Most other countries have thriving and growing wine sectors. (More on this below.)
| Global wine production 2000-2012, Mhl | |||||||||||||
|---|---|---|---|---|---|---|---|---|---|---|---|---|---|
| 2000 | 2001 | 2002 | 2003 | 2004 | 2005 | 2006 | 2007 | 2008 | 2009 | 2010 | 2011 | 2012 | (avg.) |
| 280 | 265 | 257 | 264 | 296 | 278 | 283 | 268 | 269 | 272 | 264 | 267 | 252 | (270) |
Wine production is shifting away from Europe
Europe’s share of wine global wine production is shrinking. In 2000 Europe produced 73% of all the world’s wine. Europe’s share has shrunk with 11 points to 62% of global wine production in 2012.
There is – as yet – no obvious “winner” who has taken over the major part of the share lost by Europe. Rather, all other regions have increased their share of wine production between 2000 and 2012:
- Americas: up from 17% to 19.8%
- Asia: up from 4.5% to 6.9%
- Oceania: up from 3.1% to 5.9%, almost doubling its share
- Africa: up from 4.3% to 5.1%
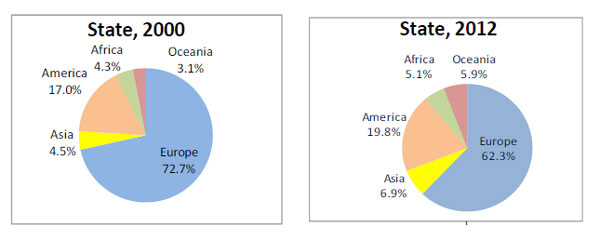
2012 was a particularly bad year for Europe, in terms of wine volumes, which aggravated the situation somewhat for Europe. But the trend is clear.
As I mentioned in the piece on vineyard acreage one can put this in the context of European (in particular EU) agricultural policies for the wine sector. Instead of promoting growth and a dynamic wine industry the European policies have been (and to a great extent still are) focussed on destruction of the production facilities, paying money to wine growers to grub up the vineyards, as well as protectionism (for example the planting rights system) and other non-dynamic initiatives (for instance protecting names/brands).
Very little has been done in the EU agricultural policies for wine to create a more dynamic and market oriented wine sector.
The biggest wine producing countries: The winner is, France. Followed by Italy
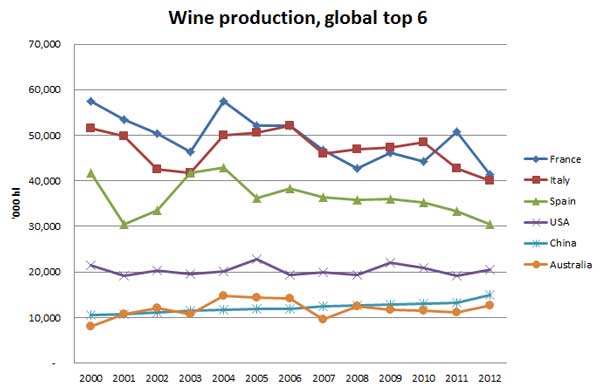
France and Italy are since long the two top wine producing countries. Since 2000 France has held the top spot, except for the four years 2007-2010 when Italy was biggest.
In 2012 France made 41.4 Mhl of wine, down 19% on the 52 Mhl it made in 2011. The average wine production was 49.3 Mhl.
Italy made 40,1 Mhl of wine in the same year, down 6% from the 42.8 Mhl it made in 2011. The average wine production was 46.9 Mhl.
2012 also represents the smallest wine harvest over the whole period for both France and Italy.
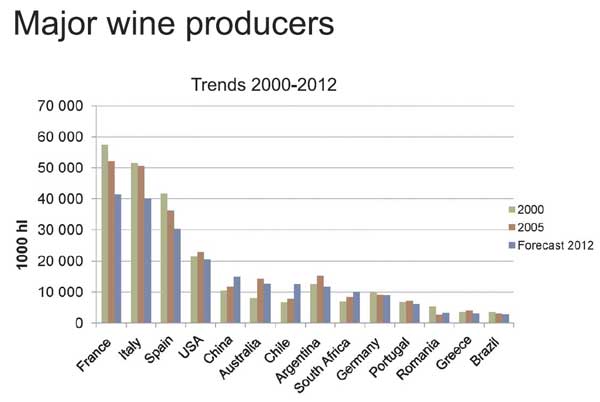
The top ten (well, eleven) countries in 2012 were:
- France, 41 Mhl
- Italy, 40 Mhl
- Spain, 30 Mhl
- USA, 20 Mhl
- China, 14.9 Mhl
- Australia, 12.7 Mhl
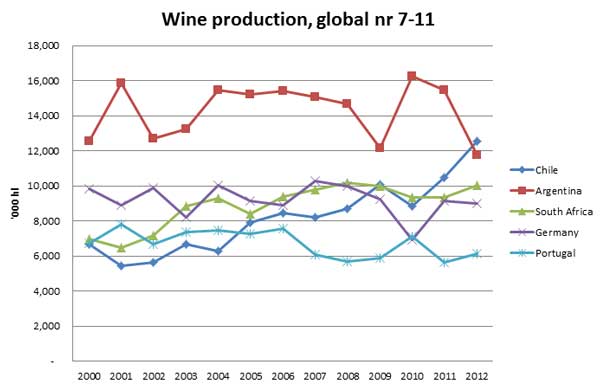
- Chile, 12.6 Mhl
- Argentina, 11.8 Mhl
- South Africa, 10 Mhl
- Germany, 9 Mhl
- Portugal 6.1 Mhl
NB: It should be noted that statistics from China are often considered very approximate.
Here’s a graphic illustration of some of the top producers (NB: this chart shows a selection of the top producers, not the top 10/11):
Here is the picture of the evolution of the wine production for the global top six:
And if we look at the following five biggest producers, number 7 to number 11 on the top list:
Growth and decline. New World up
There are several countries that have recorded significant growth in wine production:
- Chile, up 88% since 2000
- Australia, up 57%
- South Africa, up 44%
- China, up 42%
It is three New World countries that are the big gainers!
China, not what you think! At least not yet
Perhaps one of the most surprising numbers here is that China has not grown more than what it apparently has. It is often thought that wine production in China has boomed in recent years but the numbers disprove that. (And often touted in media as a catastrophe scenario for Europe. But Europe is working hard on that scenario itself. See more below.)
On the other hand, already at the start of the period in 2000 China was a significant wine producer. It has only risen one position on the ranking, from being number 6 in 2000 to becoming number 5 in 2012, displacing Argentina.
Looking back to the numbers for vineyard acreage and grape production, which both showed significant increases for China, the conclusion must be that the Chinese are making a lot of table grapes, raisins and grape juice.
The big looser: Europe
One thing that is very clear from these numbers is that the Old World European countries are the big losers. Their output of wine is shrinking rapidly.
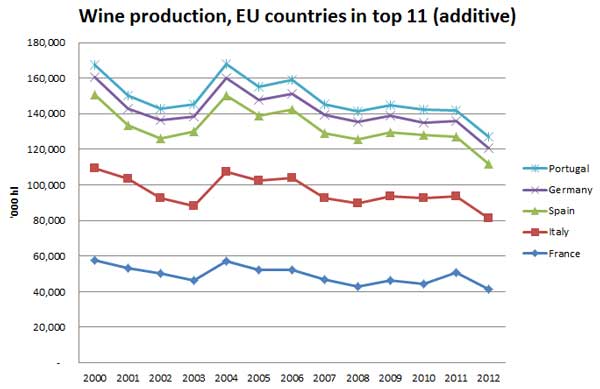
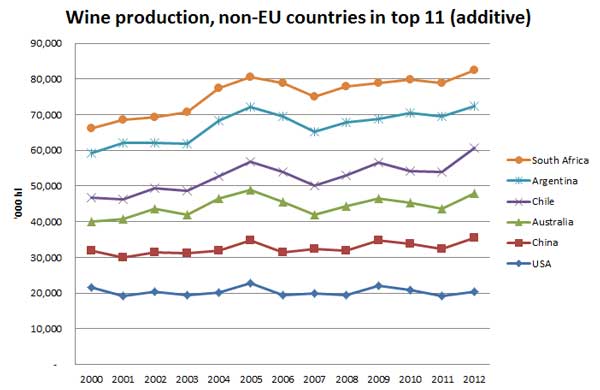
If we organise the top eleven wine producing countries in two groups, EU countries and non-EU countries, the charts show a dramatic picture:
Wine production in the EU countries on the top 10 list
Wine production in the non-EU countries on the top 10 list
All the major EU wine producing countries are declining.
All the major non-EU wine producing countries are growing their production, although the growth in the US is at best minimal (+1% compared to the average of the period).
What to make of the EU agricultural wine policies?
If the aim of the EU’s agricultural policies for wine were to strengthen the EU’s market position on the international wine market then it seems that the EU agricultural policies for wine are not succeeding. Or perhaps the EU has decided that the only way to go for the wine sector in the EU is downwards and the aim of the CAP policies for wine is to ease the pain of shrinking by giving out subsidies?
Let’s look at one more chart. Let’s assume that the trends over the period 2000-2012 will continue. What will then happen with the EU wine production and the non-EU wine production (still limiting this to the top 11 countries)?
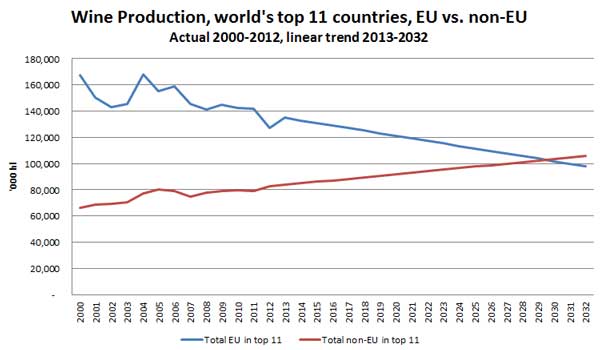
By 2030 the 6 non-EU countries will pass the 5 EU countries in making more wine. (This does not take into account all other wine producing countries. They would probably make the picture even worse for Europe.) It is of course questionable if the trends will continue like this. But why not?
Admittedly, the EU subsidies have, I believe, decreased thanks to some of the reforms initiated by the previous agricultural commissioner.
However, a lot of the focus of many wine producers’ lobbying organisations (ARVEV, CNAOC, EFOW etc, to mention just a few), as well as country governments, is still on subsidies and protectionism. That may not be the best way to create a dynamic wine industry in Europe. At least not judging from how successful that kind of policies have been so far. They seem more designed to protect current wine producers from competition from others within the region, and on demanding subsidies, rather than on creating a dynamic and profitable wine sector.
The above charts show clearly that the countries where subsidies and protectionism are not the focus, but where market dynamics more come into play, are the countries that are developing their wine production the most.
In this perspective one must question the value of “traditional” European wine market “regulations” and policies.
Europe, what kind of wine industry do you want? Subsistence based on subsidies and protectionism or profitable winemaking successful on the international wine market?
More
This is the third article in the series on global vineyard, grape growing, wine production, wine consumption, and wine trade statistics based on the latest OIV report.
- Part 1: The world’s grape growing (vineyard) surface area
- Part 2: The world’s grape production 2000-2012
- Part 3: The world’s wine production 2000-2012
- Part 4: The world’s wine consumption 2000-2012
- Part 5: The world trade in wine 2000-2012
- Part 6: World wine market, implications for winemakers, consumers and policy-makers
Source: All numerical statistics come from the OIV, International Organisation of Vine and Wine.
[box type=”info” style=”rounded” border=”full”] What better way to get an idea of the wine production than to go and enjoy the wines (and the food) on a wine tour. BKWine organises wine tours to many of the world’s wine regions, both Old World and New World. You will get the opportunity to ask the winemakers all the questions you want.[/box]




3 Responses
Excellent report. Do you have statistics on world wine production going back for the last 50 years? When did the USA become the world’s 4th largest producer?
Thank you.
No I don’t.
Quite recently I would think, but not sure when.