The biggest vine-growing countries in the world
The world’s vineyard acreage (the planted surface area) has been slowly declining for several years. 2020 was no different; the vineyard plantings declined, but only slightly. There is now 7.3 million hectares of vineyards, of which, according to our estimates three quarters are dedicated to producing wine. The five biggest countries account for half of the surface. France regains the second place this year. Read on to see all the details.
In this article:
- The world vineyard surface area in 2020 has decreased slightly
- Vineyard area in Europe is stable
- The rest of the world has declined
- The world’s biggest vineyard acreage countries, the long list
- Trends over time
- Grapes grown for other use than wine
Read all our articles in the Wine Global 2020 series here:
- Global wine production 2020
- The World’s vineyard surface 2020
- How important is wine production to a country?
- The world’s most productive wine producing countries
- World wine consumption in 2020
- Wine consumption per person in 2020
- World wine exports in 2020
- World wine imports in 2020
- Wine exports compared to total production (dependency on exports)
- Wine exports compared to GDP and to total exports
- Average price per litre on export, by country
- Exports in bottle, sparkling, bag-in-box, bulk in 2020
This is a longer version of an article published on Forbes.com.
The world vineyard surface area in 2020 has decreased slightly
The world vineyard surface area was just over 7.3 million hectares (Mha), or 18 million acres, in 2020. This is a small decrease from 2019 but, bar small changes, it has been stable since 2017, four years. The record years are 2002-2003 when the world vineyard acreage reached over 7.8 Mha (19.3 Mac). We have lost about 6% of vineyards since then.
These are the top ten countries in the world with the biggest vineyard plantings:
| Top ten countries, biggest vineyard acreage | ||
|---|---|---|
| 1 | Spain | 961,000 ha |
| 2 | France | 797,000 ha |
| 3 | China | 785,000 ha |
| 4 | Italy | 719,000 ha |
| 5 | Turkey | 431,000 ha |
| 6 | USA | 405,000 ha |
| 7 | Argentina | 215,000 ha |
| 8 | Chile | 207,000 ha |
| 9 | Portugal | 194,000 ha |
| 10 | Romania | 190,000 ha |
France has thus regained its number-two spot, again becoming the country with the second largest vineyard acreage (see more below).
Important:
These numbers include all vineyard acreage, so it includes grapes for wines and juices, table grapes and raisins. It also includes young vines not yet in production.
Note:
The numbers for 2019 are “provisional” and those for 2020 are “preliminary”, as noted by the OIV. They may change. But not that much.
Update on Chile:
A Chilean viticulturist has kindly pointed out that the Chilean vineyard surface area actually has a large portion dedicated to table grapes, and a not insignificant number for pisco production. The official numbers for 2020 are, according to our source:
- Wine grapes: 136,289 hectares
- Table grapes: 47,834 ha
- Pisco production: 9,173 ha
- Total: 193,296
The total wine production was, according to the same source: 10,337,222.88 hectolitres (that is 1,033,722,288 litres!).
The numbers used in this article come from the OIV and they generally do not show this kind of details. In most cases we estimate that this will not have a significant effect on the statistics, except as noted above. It turns out we were wrong on that in the case of Chile, which does have a large acreage for other use than wine.
Vineyard area in Europe is stable
Europe’s (which is not far from meaning “the EU’s”) vineyards are stable at 3.3 M ha, stable since seven years back. This is 45% of the global total.
Within the EU vineyard plantings are subject to government controls (“planting authorisations”). The EU countries have agreed to limit growth to 1% per year. This is apparently not a growth potential that is entirely used. The EU countries do not plant as much grapes as they could. Is this because there is not enough demand to motivate new plantings? Or is it because there are too many administrative obstacles to get authorisations? Or that the authorisations are allocated to the wrong regions? Or…?
Country by country vineyard acreage in Europe, with the change since 2019:
| Vineyard acreage in the EU, main countries | |||
|---|---|---|---|
| Acreage | change ’20/’19 | ||
| 1 | Spain | 961,000 ha | -0.60% |
| 2 | France | 797,000 ha | 0.40% |
| 3 | Italy | 719,000 ha | 0.80% |
| 4 | Portugal | 194,000 ha | -0.20% |
| 5 | Romania | 190,000 ha | -0.40% |
| 6 | Moldova | 140,000 ha | -2% |
| 7 | Greece | 109,000 ha | 0% |
| 8 | Germany | 103,000 ha | 0% |
| 9 | Bulgaria | 66,000 ha | -1.80% |
| 10 | Hungary | 65,000 ha | -3.90% |
Growth countries:
- France
- Italy
Declining countries:
- Spain
- Portugal
- Romania
- Moldova
- Bulgaria
- Hungary
Since Europe is stable, the rest of the world has declined
USA
The biggest wine producing vineyard country outside of Europe is the USA. Its vineyards have shrunk consistently over seven years and are now down to 405,000 ha. According to the OIV, this is due to an effort of solving the problem with grape over-supply.
South America
The South American vineyard area is also shrinking
- Argentina: 215,000 ha, -0.2%
- Chile: 207,000 ha, -1.2%
- Brazil: 80,000 ha, -1.2%
South Africa
South African vineyards are stable (well, almost, down -0.7%) at 122,000 ha. (Which is just a bit bigger than the vineyard acreage in Bordeaux.) This is good news for South Africa. From 2015 to 2018 they had a period of severe drought that resulted in a loss of 10,000 ha.
Australia and New Zealand
The odd-man-out here is Oceania. Australian vineyards remain stable at 146,000 ha. New Zealand, that has been very successful in winning new markets and establishing a premium reputation for wine, increased the vineyard area with 2% to 40,000 ha.
Special cases: China and Turkey
China
A few years back, China caused a lot of brouhaha when it became the country with the world’s second largest vineyard acreage, overtaking France and being second only to Spain. It was unfortunately widely misreported as “China becomes the second largest wine producer in the world”, which was not the case. It only had the biggest vineyard surface.
This has now changed. China has now the third largest vineyard acreage in the world: 785,000 ha, after Spain and France. France has regained the position as the country with the second largest vineyard acreage. This happens although the Chinese vineyard acreage is estimated to have grown with 0.6% (+4,000 ha).
In fact, the “Third National Agricultural Census in China” has resulted in a substantial revision downwards of the vineyard acreage, says the OIV, pushing China down to third place. Presumably, this revision means that China never actually did have the world’s second largest vineyard surface. But that is, of course, a guess.
Nevertheless, for four consecutive years the Chinese vineyard acreage has increased: up 3.3% since 2017. If this trend continues it is only a matter of time before China will (for real?) overtake France and become the second largest vine-growing country. But one should keep in mind that most the grapes in China are not used for making wine. See more on this below.
Turkey
Turkey, another country with vast vineyards but that make little wine, saw a decline in acreage: -1.1% to 431,000 ha.
The world’s biggest vineyard acreage countries, the long list
This table includes countries with more than 50,000 ha in 2020, 25 countries.
| Rank | Country | 2020 (prel) | ’20/’19 | % of world acreage 2020 | Cumul % | 2019 (prov) | 2018 | 2017 | 2016 |
|---|---|---|---|---|---|---|---|---|---|
| 01 | Spain | 961 | -0.6% | 13.1% | 966 | 972 | 968 | 975 | |
| 02 | France | 797 | 0.4% | 10.9% | 24% | 794 | 792 | 788 | 786 |
| 03 | China # | 785 | 0.6% | 10.7% | 35% | 781 | 779 | 760 | 770 |
| 04 | Italy | 719 | 0.8% | 9.8% | 45% | 713 | 701 | 699 | 693 |
| 05 | Turkey | 431 | -1.1% | 5.9% | 50% | 436 | 448 | 448 | 468 |
| 06 | USA # | 405 | -0.4% | 5.5% | 56% | 407 | 408 | 434 | 439 |
| 07 | Argentina | 215 | -0.2% | 2.9% | 59% | 215 | 218 | 222 | 224 |
| 08 | Chile # | 207 | -1.2% | 2.8% | 62% | 210 | 208 | 207 | 209 |
| 09 | Portugal | 194 | -0.2% | 2.7% | 64% | 195 | 192 | 194 | 195 |
| 10 | Romania | 190 | -0.4% | 2.6% | 67% | 191 | 191 | 191 | 191 |
| 11 | Iran * # | 167 | 0.0% | 2.3% | 69% | 167 | 167 | 153 | 168 |
| 12 | India * # | 151 | 0.0% | 2.1% | 71% | 151 | 149 | 147 | 131 |
| 13 | Australia | 146 | 0.0% | 2.0% | 73% | 146 | 146 | 145 | 145 |
| 14 | Moldova | 140 | -2.0% | 1.9% | 75% | 143 | 147 | 151 | 145 |
| 15 | South Africa | 122 | -0.7% | 1.7% | 77% | 122 | 123 | 128 | 130 |
| 16 | Uzbekistan * # | 112 | 0.0% | 1.5% | 78% | 112 | 108 | 111 | 131 |
| 17 | Greece * # | 109 | 0.0% | 1.5% | 80% | 109 | 108 | 106 | 105 |
| 18 | Germany * # | 103 | 0.0% | 1.4% | 81% | 103 | 103 | 103 | 102 |
| 19 | Russia | 96 | 0.6% | 1.3% | 83% | 96 | 93 | 90 | 88 |
| 20 | Afghanistan * # | 96 | 0.0% | 1.3% | 84% | 96 | 94 | 94 | 89 |
| 21 | Brazil | 80 | -1.2% | 1.1% | 85% | 81 | 82 | 84 | 86 |
| 22 | Egypt * # | 79 | 0.0% | 1.1% | 86% | 79 | 80 | 84 | 83 |
| 23 | Algeria * # | 66 | 0.0% | 0.9% | 87% | 66 | 75 | 75 | 76 |
| 24 | Bulgaria | 66 | -1.8% | 0.9% | 88% | 67 | 67 | 65 | 64 |
| 25 | Hungary | 65 | -3.9% | 0.9% | 89% | 67 | 69 | 68 | 68 |
| ? | Georgia | 49 | 0.7% | ||||||
| ? | Austria | 48 | 0.7% | ||||||
| ? | New Zealand | 40 | 0.5% | ||||||
| X1 | Other countries | 690 | 0.0% | 11.3% | 100% | 827 | 811 | 812 | 816 |
| X2 | World total | 7331 | -0.2% | 100.0% | 7342 | 7333 | 7326 | 7379 |
* – indicates that it is a figure carried over from the latest available data.
# – indicates that the latest number is an OIV estimate.
? – indicates that these three countries are not necessarily the following three in size but have been added since they are of particular interest, especially for wine production (cf. the wine production article)
Domination of the big countries
The top five of the vine growing countries – Spain, France, China, Italy, Turkey – represent 50% of the world surface area.
The top five of the wine producing countries (thus removing Turkey and adding USA) equally represent 50% of the world surface area.
The top twenty-five of the vine growing countries represent almost 90% of the world surface area. All the remaining countries that grow wine have, put together, a vineyard acreage of about the same size as France.
Trends over time
This picture is quite consistent with a view of the evolution over the last 11 years, 2010 to 2020. Looking at the 11-year trends shows some additional nuances.
Spain:
Acreage is shrinking steadily. At the beginning of the period there was over 1,000,000 hectares. Now only 961,000 ha remain.
France:
France shows an up-and-down pattern, or rather, down-and-up. In recent years acreage has grown slightly. Can that be the result of the previously very restrictive policy of “planting rights” having been relaxed with the “planting authorisations”? Earlier in the period, French vineyards were shrinking but now it is growing.
China:
After a dramatic rise early in the period the evolution has slowed down, but still going up. An effect of the demand for wine also slowing down?
Italy:
Italy shows the same pattern as France, first down and then up, since 6 years on an upward trend. Also because of it being easier to get authorisations to plant?
USA:
USA is in its eighth year of decline. According the estimates by the OIV due to a glut of grapes. That seems not (yet?) to have been reflected in a decline in wine prices, as far as I know. (Or is it?)
Argentina, Chile, Romania:
All quite stable over time.
Portugal:
A stable and substantial decline over the period. Is this due to Portuguese wine producers having difficulties selling their wines, and some choosing to leave the industry?
Australia, South Africa:
Two countries declining over the period, Australia more rapidly than South Africa. To some extent that is probably due to climate challenges (drought) in both countries. Could over-production have been an added reason in Australia?
Moldova:
A rise followed by a decline. The OIV estimates that it is possibly the effect of the “restructuring” of the vineyards. I think it can be for two other possible reasons: 1) that the statistics are being improved and becoming more accurate, and 2) abandoned vineyards (of which there is quite a lot) are being removed (either physically, or just statistically).
Greece, Germany:
Two countries that are stable over the period.
Russia:
A substantial increase over seven years. I have no specific explanation to suggest for that. Any suggestion?
Important: This is vines, not wine.
Grapes grown for other use than wine
As mentioned above, these numbers include all vineyard acreage, so it includes grapes for wines and juices, table grapes and raisins. It also includes young vines not yet in production.
So let us make an estimate of how much of this is used for making wine. NB: This is our estimate, not one made by the OIV.
The main countries that grow grapes to a significant extent for other purposes than wine are the following. The estimates of surface for wine is based on various sources, including the countries known wine production:
| Country | Total vineyard acreage | Estimate, for producing wine |
|---|---|---|
| China | 785 kha total (thousands hectares vineyards) | 190 kha for wine |
| Turkey | 431 kha | insignificant |
| USA | 405 kha | 305 kha for wine |
| Iran | 167 kha | insignificant |
| India | 151 kha | insignificant |
| Uzbekistan | 112 kha | insignificant |
| Greece | 109 kha | 59 kha for wine |
| Afghanistan | 96 kha | insignificant |
| Egypt | 79 kha | insignificant |
| Algeria | 66 kha (uncertain number) | 8 kha for wine |
Here are the main assumptions for the estimate of how much hectares these countries use for wine production:
China:
China makes almost as much wine as Portugal (6.6 Mhl and 6.4 Mhl). Portugal’s acreage is 194 kha.
- Estimate: 190 kha for wine. 595 kha for “other use”
USA:
Around 100 kha are planted with grape varieties that are not normally used for wine (sultanina, concord,…)
- Estimate: 305 kha for wine, 100 kha for “other use”
Greece:
We estimate, based on various sources that slightly less than half is used for “other”
- 59 kha for wine, 50 kha for “other”
Algeria:
They do make wine, but wine.plus estimates the production to 0.5 Mhl and says that the vine acreage is estimated to 8,300 ha by Kym Anderson of the University of Adelaide.
- Estimate: 8 kha for wine, 58 kha for “other use”
All other countries on the list:
An insignificant amount of acreage is used for wine
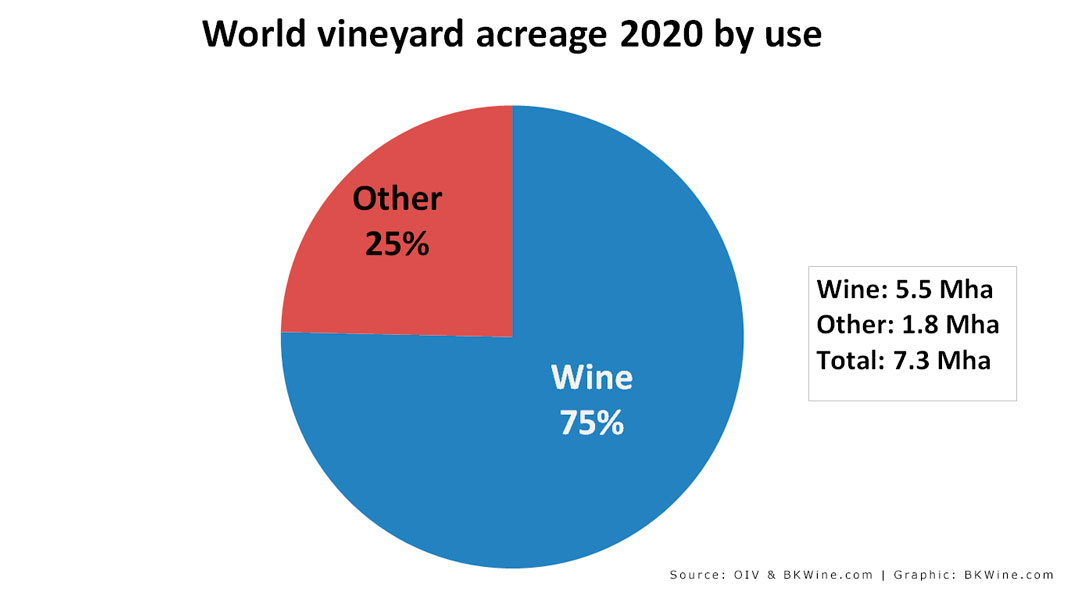
25% of vineyards are used for other products than wine
This means that the world surface area of vines not used for wine production can be estimated to: 1.8 Mha.
The total vineyard acreage to grow grapes used for making wine can thus be estimated to approximately 5.5 million hectares.
In other words: 75% of the world vineyards are used for wine. Maybe somewhat less since some other winemaking countries also have production of raisins, grape juice and other non-wine products. And 25% is used for “other”, for juice, table grapes and other.
For a more long-term historical perspective, covering the period 2000-2012, you can read our previous article: The world’s grape growing (vineyard) surface area 2000-2012.
Sources: all data comes from the OIV (International Organisation of Vine and Wine) report “State of the world vitivinicultural sector in 2020”, unless otherwise stated.
Travel
Why not go and take a look for yourself? Go visit a vineyard and check what the state of vine growing is? You can do that on a wine tour with BKWine to one of the many vine growing countries in the world.
Travel to the world’s wine regions with the wine experts and the wine travel specialist.
State-of-the-art wine tours. BKWine wine tours.


