Global wine consumption: who drinks the most wine?
Global wine consumption was stable in 2012 at 243 Mhl. Since 2000 wine consumption has increased somewhat, up 8%. After a peak at 255 Mhl in 2007 it went down but with the stable figure for 2012 the downward trend seems to be stopped. The European countries, traditional big drinkers, are decreasing their consumption, although France keeps the number 1 slot (for the moment). The US is likely to be confirmed as the biggest single wine market. Together with Russia, China, United Kingdom and Australia it is also a growth market.
Now it is time for the really fun part: wine consumption. I have already looked at vineyard acreage, grape production, and wine production.
All numbers come from the recent OIV (International Organisation of Vine and Wine) report.
Global wine consumption in 2012 was stable at 243 million hectolitres, compared to 2011. Since 2000 the trend has been upwards, increasing from 226 Mhl in 2000. However, after a peak at 255 Mhl in 2007 went down to just over 240 Mhl and has been practically constant for the last four years.
The world-wide wine consumption has increased with 8% since 2000 from 226 Mhl to 243 Mhl.
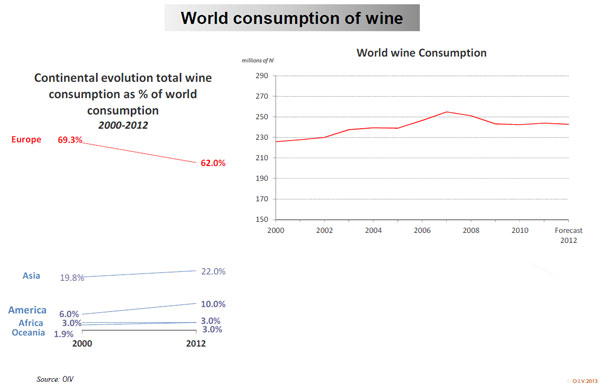
The world-wide trends are similar to the other parts of this report: Europe is declining, consuming less and less wine and the rest of the world is increasing. In 2000 Europe represented 69% of global wine consumption but in 2012 only 62%.
The biggest wine consumer: France, but not for long
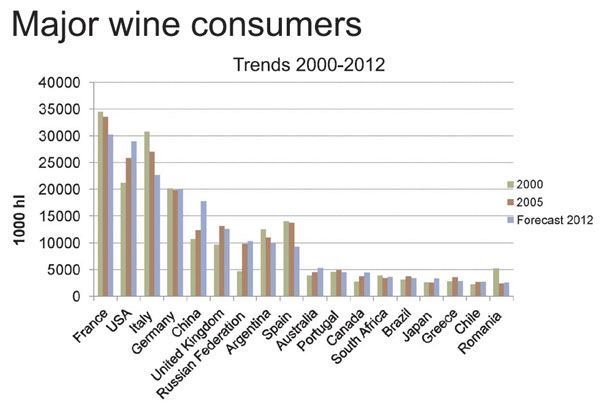
Contrary to some other statistic these numbers from the OIV still show France as the biggest country for wine consumption in 2012. USA comes in second place. (Some sources have placed the US in first place as the biggest wine consumer in 2012.)
The trend is clear though. It is very likely that the US will become the biggest wine consuming country in 2013.
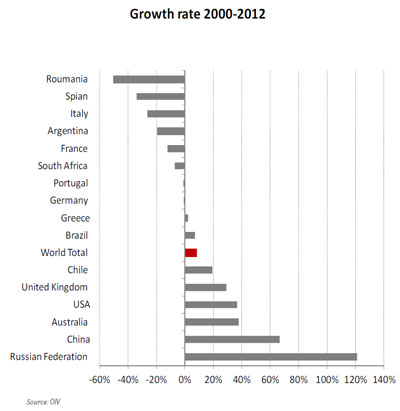
The traditional big European wine consuming, and producing, countries show shrinking consumption:
- France, -12% over the period
- Italy, -27%
- Spain, -34%
The biggest growth markets have been
- Russia, +121% over the period
- China, +67%
- Canada, +62%
- Australia, +38%
- USA, +37%
Taking the top ten biggest wine consuming countries in total volume and looking at the trend for each, here’s how it looks (percentage indicates change 2000-2012):
- France: 30.2 Mhl, -12%
- USA: 29 Mhl, +37%
- Italy: 22.6 Mhl, -27%
- Germany: 20 Mhl, -1%
- China: 17.8 Mhl, +67%
- United Kingdom, 12.5 Mhl, +29%
- Russian Federation: 10.4 Mhl, +121% (!)
- Argentina: 10 Mhl, -20%
- Spain: 9.3 Mhl, -34%
- Australia: 5.4 Mhl, +38%
Biggest per capita consumption: Traditional wine countries still in the lead
Just as interesting (or perhaps even more) is to look at how the consumption looks per capita. Even though the traditional Old World wine countries have seen declining numbers here too they are still solidly in the lead.
Top ten wine consuming countries, per capita:
- Luxembourg, 50.7 litres wine per capita per year
- France, 47.7 l/c
- Portugal, 42.5 l/c
- Italy, 37.1 l/c
- Croatia, 34.4 l/c
- Slovenia, 33.1 l/c
- Denmark, 32.6 l/c
- Austria, 29.7 l/c
- Belgium, 27.8 l/c
- Greece, 25.6 l/c
(It is sometimes pointed out that the number for Luxembourg may be overstated. Alcohol is comparatively cheap there so much of it may be bought by visitors from neighbouring countries.)
The following ten, places 11 to 20, according to the OIV statistics:
- Argentina, 24.4 l/c
- Germany,24.4 l/c
- Australia, 23.5 l/c
- Netherlands, 22.8 l/c
- Hungary, 21.1 l/c
- Sweden, 21.1 l/c
- Spain, 19.9 l/c
- UK, 19.9 l/c
- Ireland, 17.5 l/c
- Czech Republic,17.4 l/c
USA comes in on no more than on 23rd place at 9.2 l/c.
Russia is number 24 at 7.3 l/c but growing rapidly as mentioned above.
Wine consumption growth markets
The biggest growth in total volume has been in Russia, growing at a stunning 121% over the period.
However, that growth mainly took place in the first half of the 00s (thus with even more impressive growth numbers). Since 2006 per capita and total consumption in Russia has been quite stable and even somewhat shrinking. A reflection of the abrupt stop that the Russian boom came to in the mid-00s?
China is steadily growing over the period, +67% in total. It remains to be seen what will happen in 2013 since many indicators seem to point to a slowing growth in China.
The growth of the total volume in the USA has been steady over the period (+37%).
The UK shows a similar picture to Russia… There was a rapid growth up until 2007 but since then consumption has gone down, although over the full period growth reached 29%.
Or in graphic form (not all countries included):
Wine consumption in Sweden
Being Swedish I will take a quick look also at the Swedish wine consumption in particular.
Sweden is not among the top 18 wine consuming countries in absolute numbers. (It’s position is not shown in the OIV numbers.)
For wine consumption per person Sweden comes in as number 16 at 21.1 litres per capita.
The wine consumption has gone up with 59% between 2000 and 2012. The pattern has been irregular, with a steady rise between 2000 and 2002 and a sharp rise in 2007 and 2008.
But since 2008 the per capita consumption in Sweden has been steady and even marginally shrunk. It went down 2.7% from the peak year 2008 to 2012.
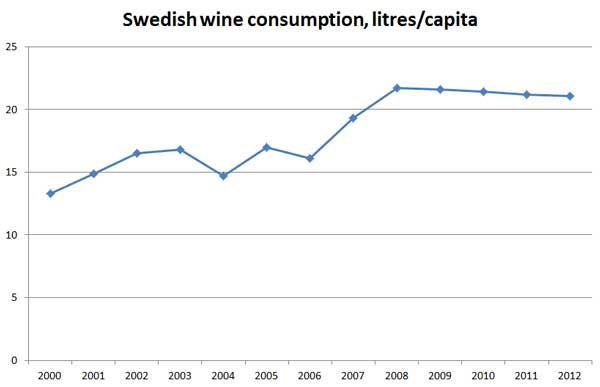
It has been argued (and I will come back to that in another article) that the sharp rise in ’07 and ’08 could be due to the (very partial) liberalisation of the Swedish alcohol market at that time, and that the flat development after that is due to that the “novelty value” wore off of the more liberal alcohol rules that were introduced around 2006/2007.
It has been cited as an example of a successful liberalisation of alcohol restrictions. It should be noted that this liberalisation was, to a very large extent, forced onto Sweden by the free market regulations of the EU and was not an initiative by liberalising Swedish politicians who, on the contrary, largely remain repressive as far as alcohol regulations go.
More
This is the fourth article in the series on global vineyard, grape growing, wine production, wine consumption, and wine trade statistics based on the latest OIV report.
- Part 1: The world’s grape growing (vineyard) surface area
- Part 2: The world’s grape production 2000-2012
- Part 3: The world’s wine production 2000-2012
- Part 4: The world’s wine consumption 2000-2012
- Part 5: The world trade in wine 2000-2012
- Part 6: World wine market, implications for winemakers, consumers and policy-makers
Source: All numerical statistics come from the OIV, International Organisation of Vine and Wine.
[box type=”info” style=”rounded” border=”full”]You can improve the world’s wine consumption numbers rapidly by coming on a wine tasting tour to a wine region with BKWine. You will have the opportunity to consume a wide range of wines![/box]




2 Responses