Italian wines overtook South African in 2012 as most popular
During four years South Africa has been the best selling wine supplier country to Sweden. In 2012 they had to hand over the top spot to Italy. Sales of Italian wines increased strongly in 2012. Swedes bought 20% more wine from Italy in 2012 than the previous year. At the same time, South Africa wine producers lost 9% of sales.
The top three countries were:
- Italy
- South Africa
- Australia
So suddenly and dramatically Italy took the lead as the country that is the biggest supplier to Swedes increasingly wine thirsty throats. (However, it should be noted that the statistics cover sales at the monopoly retail stores run by Systembolaget. Curiously, sales at Systembolaget accounts for only around 50% of alcohol consumption in Sweden.)
Top five countries
Ever since Spain fell down to number 4 in 2007 the top three countries have been South Africa (in the lead until 2012), Italy and Australia.
France seems to have a permanent booking to the number 5 spot.
- Spain
- France
After the top five the list is stubbornly static:
- Chile
- USA
- Germany
- Argentina
- Portugal
- Hungary
There are a few changes from year to year in the exact order and sometimes Hungary replaces Portugal as number 10.
The big dominate
The top three countries account for around 50% of all wine sales. The distribution changes a bit between the top three but the total is quite stable. There is possibly a slight tendency to an increasing domination.
If we take the top ten countries the domination is total. The top ten account for 95% all wine sales.
It’s bag-in-box that makes a difference
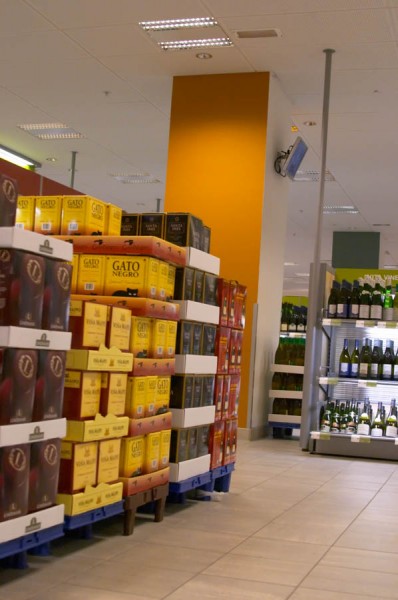
The most important influencer, perhaps the only important factor, of the top sales statistics are the bag in box sales. Bag in box (“box wines” in Sweden) accounts for more than 60% of all wine sales in Sweden!
A success in the BiB sector can have an enormous impact.
A wine called Castelforte Appassimento went from basically no sales in 2011 to 2.44 million litres in 2012.
(Castelforte Appassimento is an “amarone style” wine, what must not be called a “baby amarone”, or a “mini-amarone” made with the appassimento method, drying of the grapes. How a wine can be made with that labour and time consuming method and sold to the consumer for only around 5 euros is a mystery.)

Another newcomer on the bag-in-box listing is Il Barone Rosso that went from almost nothing to 1.2 million litres in 2012. It also happens to be the cheapest BiB on sale in Sweden at 129 kr for three litres (equivalent to around 3.50 euro per bottle).
Those two taken together make up almost 2% of all wine sales in Sweden and represent half of the increase in sales of Italian wine.
You can find a more thorough analysis in the Swedish version of this article (use Google Translate!).
Here are the details:
Top 10 countries supplying wine to Sweden, sales excluding fortified wines, 2012
| Country | 2012 | Change (%) | market share | |
| 1 | Italy | 39 776 164 | 19,9 % | 21,0 % |
| 2 | South Africa | 33 995 144 | -8,8 % | 17,9 % |
| 3 | Australia | 21 756 770 | -6,3 % | 11,5 % |
| 4 | Spain | 20 912 695 | -3,6 % | 11,0 % |
| 5 | France | 18 187 210 | 4,3 % | 9,6 % |
| 6 | Chile | 13 699 139 | 5,8 % | 7,2 % |
| 7 | USA | 12 214 523 | 12,7 % | 6,4 % |
| 8 | Germany | 8 154 073 | -1,2 % | 4,3 % |
| 9 | Argentina | 5 559 934 | -4,1 % | 2,9 % |
| 10 | Portugal | 5 192 798 | 4,0 % | 2,7 % |
| 11 | Hungary | 4 037 273 | -5,1 % | 2,1 % |
| 12 | New Zealand | 1 570 336 | 12,0 % | 0,8 % |
| 13 | Bulgaria | 1 539 248 | -4,2 % | 0,8 % |
| 14 | Swedish brands | 773 703 | 34,7 % | 0,4 % |
| 15 | International | 726 183 | 7,7 % | 0,4 % |
| 16 | Austria | 690 835 | 5,1 % | 0,4 % |
| 17 | Romania | 280 064 | 2,6 % | 0,1 % |
| 18 | Other | 522 352 | -11,1 % | 0,3 % |
| 19 | Other | 112 372 | -63,2 % | 0,1 % |
| 20 | Other | 58 964 | 2,0 % | 0,0 % |
| Total (litre) | 189 759 777 | 2,0 % |
(What the difference is between the three ”Other” is unclear. Equally what is meant with “international”. Probably it means with no specific country as origin. “Swedish brands” probably means any wine made in Sweden, be it from grapes grown in Sweden or in other countries.)
Top 10 countries supplying wine to Sweden, sales excluding fortified wines, 2009-2012
| 2012 | 2011 | 2010 | 2009 | |
| 1 | Italy | South Africa | South Africa | South Africa |
| 2 | South Africa | Italy | Italy | Italy |
| 3 | Australia | Australia | Australia | Australia |
| Top 3, share | 49,9 % | 50,3 % | 51 % | 50,9 % |
| 4 | Spain | Spain | Spain | Spain |
| 5 | France | France | France | France |
| 6 | Chile | Chile | Chile | Chile |
| 7 | USA | USA | Germany | Germany |
| 8 | Germany | Germany | USA | USA |
| 9 | Argentina | Argentina | Argentina | Argentina |
| 10 | Portugal | Portugal | Hungary | Hungary |
| – | ||||
| Top 10, share | 94,5 % | 91,7 % | 94,3 % | 94,1 % |
| Total, all countries (litres) | 189 759 777 | 186 038 877 | 182 471 261 | 175 819 191 |
| Change year on year | 2 % | 2 % | 3,8 % | 9,3 % |
–
Top 10 countries supplying wine to Sweden, sales excluding fortified wines, 2005-2008
| 2008 | 2007 | 2006 | 2005 | |
| 1 | South Africa | Australia | Spain | Spain |
| 2 | Italy | South Africa | Italy | Italy |
| 3 | Australia | Italy | South Africa | South Africa |
| Top 3, share | 48,4 % | 47,6 % | 46,4 % | 47,9 % |
| 4 | Spain | Spain | Australia | Australia |
| 5 | France | France | France | France |
| 6 | Chile | Chile | Chile | Chile |
| 7 | USA | USA | USA | USA |
| 8 | Germany | Germany | Germany | Germany |
| 9 | Argentina | Argentina | Hungary | Hungary |
| 10 | Hungary | Portugal | Portugal | Portugal |
| Top 10, share | 94,5 % | 96,7 % | 94,1 % | 94,6 % |
| Total, all countries (litres) | 160 853 533 | 154 020 416 | 145 265 930 | 137 657 761 |
| Change year on year | 4,5 % | 6 % | 5,5 % |


